01 Challenge
Disconnected systems, weak visibility
Operations data was spread across disconnected systems, making it difficult to monitor asset state, contextual performance, and planning actions in one view.
Client/Sector: Maritime operations stakeholders
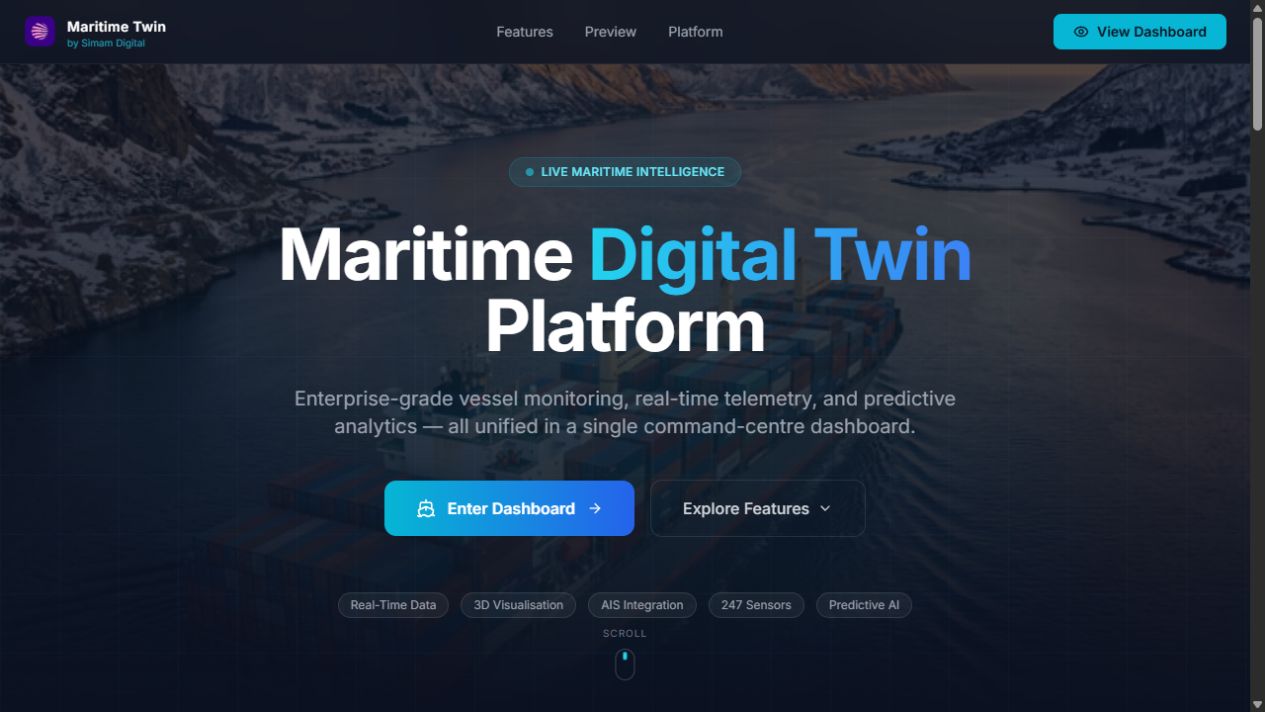
A spatial operations dashboard built to bring scattered maritime data into one readable environment for monitoring, planning and decision support.
Project Snapshot
01 Challenge
Operations data was spread across disconnected systems, making it difficult to monitor asset state, contextual performance, and planning actions in one view.
02 Approach
I designed an interactive digital twin dashboard that combines spatial context, KPI visibility, and operational signals in a single decision surface.
03 Execution
I handled data model planning, API integration strategy, and frontend architecture for interactive map and status components.
04 Outcome
Operational teams gained a clearer real-time picture of assets and status, improving planning confidence.
Technical delivery
The maritime twin treated maps and 3D context as part of an operational system rather than decoration. The central engineering question was how vessel, voyage, KPI and alert data could share one model and remain readable at different geographic scales.
Position, destination, schedule, performance and operational condition arrive with different update frequencies. The frontend architecture normalised those concerns around vessel and voyage entities so map markers, KPI cards and detail views could remain consistent while data refreshed independently.
A global view supports fleet awareness but can quickly become noisy. Clustering, status hierarchy, filters and drill-down patterns were used to move from fleet-level exceptions to one asset's operational context. The design preserved geographic meaning while making non-spatial performance data available at the point of decision.
The POC separated presentation from source-specific adapters, leaving room for AIS, operational systems or simulated feeds without embedding one vendor's payload throughout the UI. It demonstrates how I structure a digital-twin conversation around entities, update cadence, uncertainty and user action—not only a 3D scene.
Project summary
The essential product, role and delivery context behind the work.
Short answers for people comparing vendors, project approaches and similar technical work.
A maritime digital twin is a software view of maritime assets or operations used to monitor status, KPIs and operational context.
No. Many maritime digital twins are strongest when dashboards, maps, alerts and KPIs are combined with selective visualisation.
This case study supports digital twin developer, maritime SaaS and operational dashboard searches.