Home / Case Studies / Magnopus Construction Site Platform

Spatial web / construction All case studies

Magnopus Construction Site Platform

Client/Sector: Magnopus / construction technology

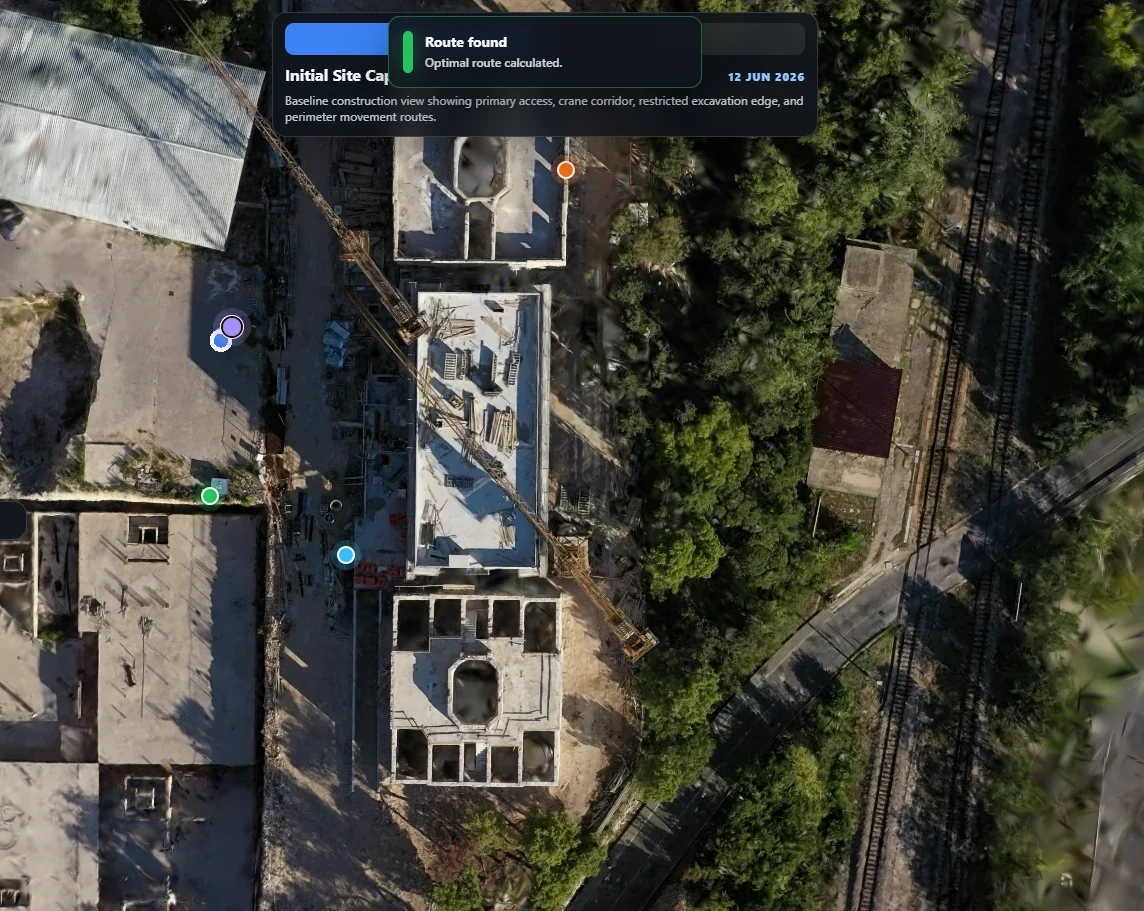
Two phases of browser software for a large construction programme. First, a Gaussian-splat viewer of the live site, built from drone footage, with a capture timeline and walkable routing on a phone. Then a full site operations and routing application, now in daily use by site staff and programme leadership.

Project Snapshot

  • RoleFull-stack web and spatial engineer (contract), June to September 2026.
  • PlatformBrowser and phone: TypeScript, React, PlayCanvas, three.js, GIS routing.
  • OutcomePhase 2 is in daily use by site staff and programme leadership.
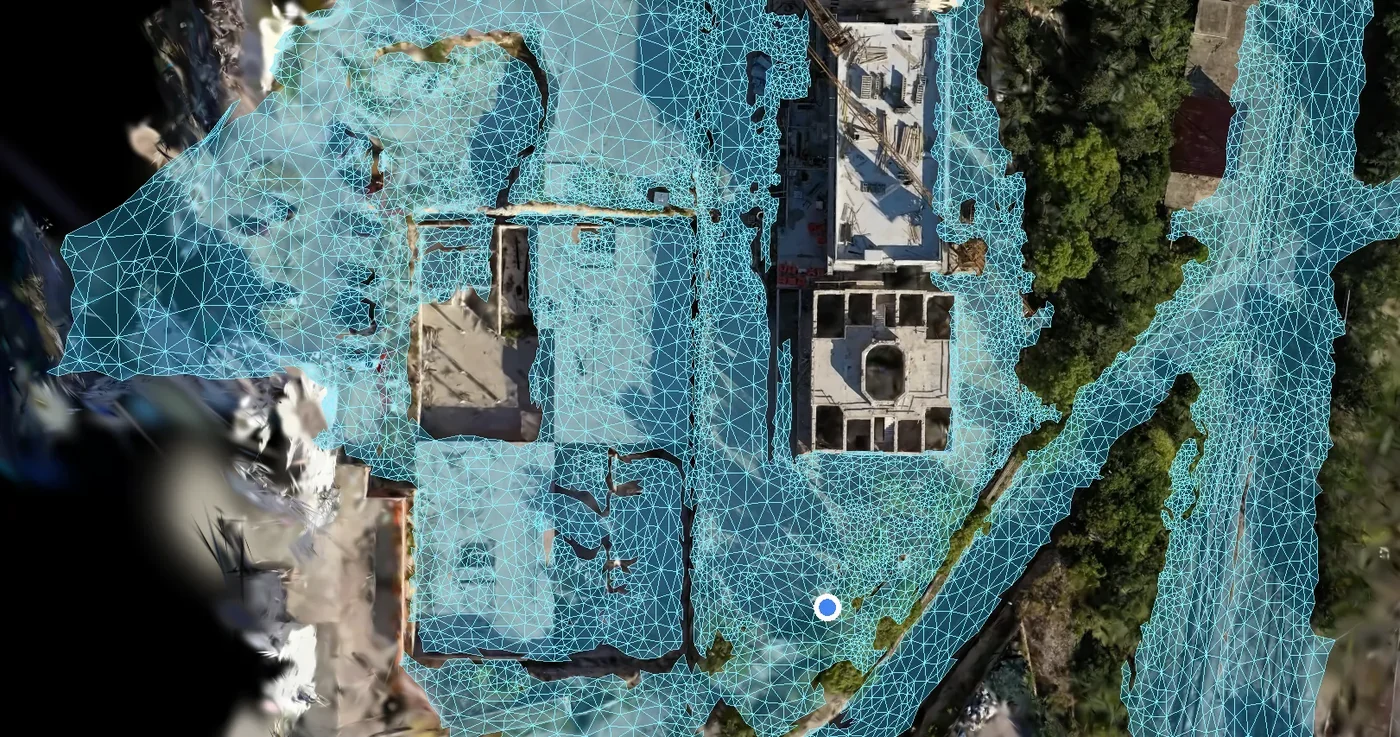
Drone capture of a construction site with the derived walkable navigation graph drawn over it as a cyan triangle mesh

Why this work mattered

A map for a site that changes every week

Large construction sites change faster than the drawings that describe them, and they are on no consumer map. People find their way around from memory, radio and paper. The work answered two questions: can a person be routed across a raw, photoreal drone capture of the site in a browser, and can the whole programme run on one live map that respects closures and hazards as they happen?

  • Photoreal and recognisableSite teams see the ground they actually poured last week, not an abstract plan.
  • Built for a phoneThe person who needs the route is standing on the site, so the phone layout came first.
  • In daily useThe phase 2 application is used every day by site staff and programme leadership.

01 Challenge

Routing over a scan that knows nothing about ground

A Gaussian splat is purely visual: it has no surface, no collision and no idea what is walkable. Routing libraries expect a hand-authored navigation mesh, and a drone scan is triangle soup in which a floor and a car roof look the same.

02 Approach

Treat the scan mesh itself as the route graph

Each walkable triangle of the collision mesh became a node and each shared edge a connection, filtered by slope, height and connectivity so the router never sends anyone up a tree or along a roof. Phase 2 moved routing to an authoritative server-side GIS path graph.

03 Execution

From a photoreal viewer to a live site map

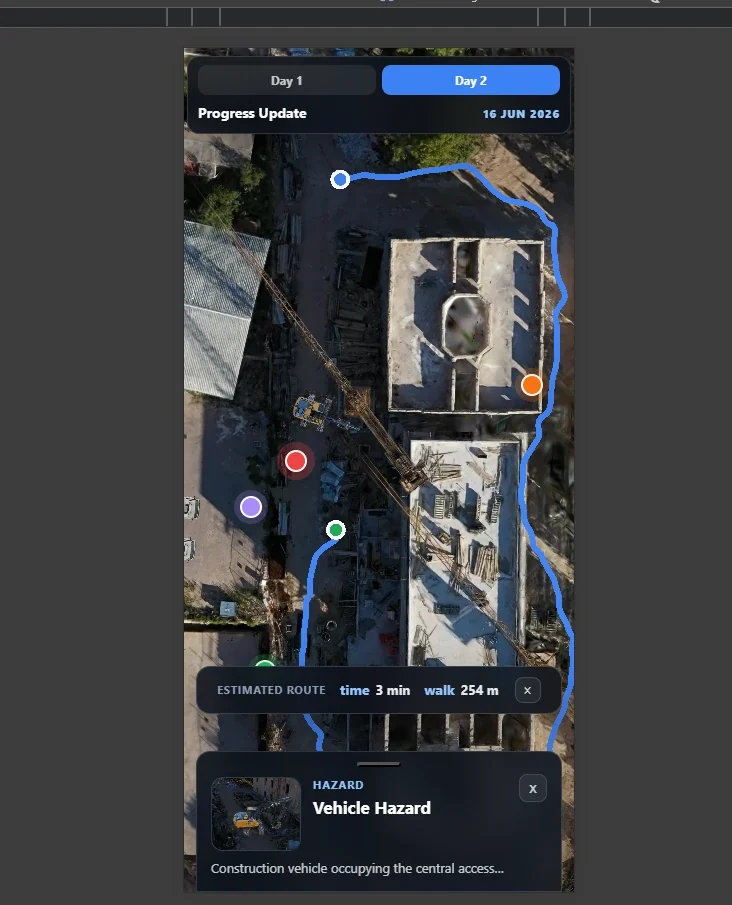
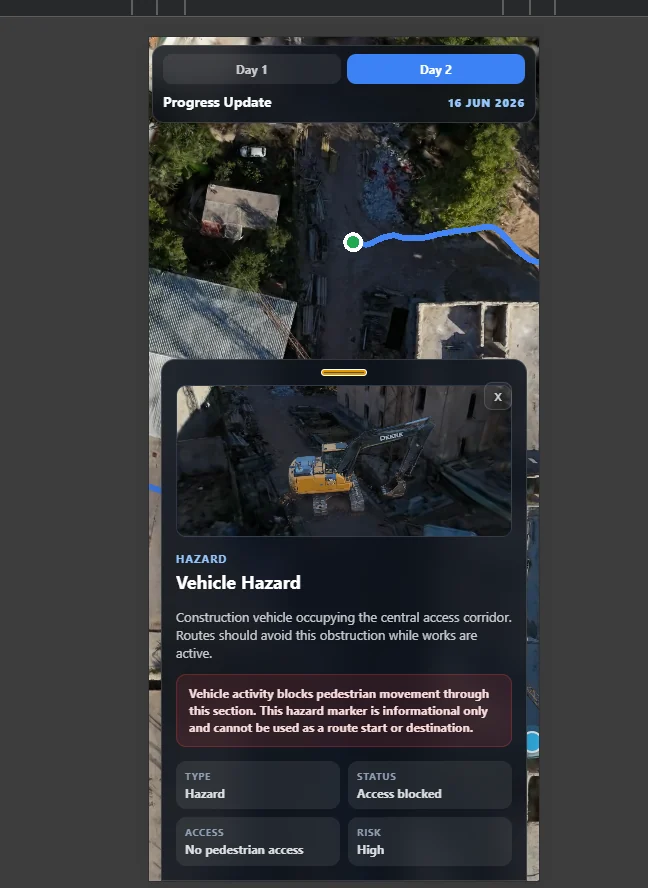
Phase 1 delivered the splat viewer with several dated captures of the same site, a pipeline to turn new drone footage into splats and load them automatically, and tap-to-route on a phone. Phase 2 delivered a site operations app: satellite, land-use and masterplan overlays, a 3D model of the completed site, live GPS, closure-aware routing, hazard zones with an advisory predicted-hazard layer, authenticated drawing tools and role-based access.

04 Outcome

A proof of concept that became a daily tool

The work was scoped against numbered acceptance criteria and delivered in daily, demoable increments. Phase 2 was delivered as a phased proof of concept and is now in daily use by site staff and programme leadership.
Engineering deep dive

Making raw site data usable on a phone

Both phases dealt with data that was never meant for the web: multi-million-triangle scans, a 9 GB orthophoto, two-hundred-megapixel engineering sheets and a 219 MB architectural model, used outdoors on one of the worst mobile networks there is.

  1. Drone footage and engineering data
  2. Splat, tile and model pipelines
  3. Baked route graph and GIS path graph
  4. Routing, closures and hazards
  5. Phone and browser views

Six filters, none sufficient alone

Scan meshes melt: walls slump, trees become cones and debris becomes ramps, and a melted surface looks like a gentle path. Walkability came from a stack of filters: a face-normal limit of about 37 degrees, a traversal slope limit of about 31 degrees, height and depression filters, keeping only the largest connected island, an A* cost that penalises climbing, and a final check that rejects implausible elevation spans.

Built ahead of time, checked at runtime

Building the graph over a multi-million-triangle mesh is too slow on a phone, so it is baked at build time into compact adjacency data. The example capture bakes to about 10,500 nodes and 14,200 connections. At runtime the bake is checked against the loaded mesh's triangle count, with an automatic fallback if someone edits the mesh and forgets to rebake.

Two honest results

A height-above-local-ground filter was built and then removed: on a site with deep interiors and an excavation pit, "local ground" is ambiguous and the filter carved away real walkable surface. Detecting parked vehicles directly from the scan also proved unreliable, so obstacles are handled by cutting their footprint from the collision mesh or declaring a hazard zone.

The GIS service is the router

In phase 2, shortest paths run server-side over a GIS path graph in BigQuery, with closed edges removed from the graph before the search rather than filtered from the result afterwards. A route requested while a path is closed comes back around it. A client-side snap engine was kept for parts of the site with no paths and for offline use.

Nine gigabytes of photograph on a phone

The orthophoto and georeferenced masterplan sheets were turned into XYZ tile pyramids, so the browser only fetches tiles in view at the zoom in use. Reprojection from the site's UTM zone to Web Mercator was done per tile, because grid north and true north differ by about 0.7 degrees there and a single transform per sheet visibly skews it.

3.5 million triangles in a browser tab

The completed-site model arrived as a 219 MB export and is rendered live on the map with three.js after Draco compression to about 19 MB. Compression was verified by triangle count rather than by eye, which caught a separate export that had silently lost most of its geometry in conversion.

Prediction kept separate from fact

Declared hazard zones sit alongside a predicted-hazard layer scored by Gemini on Vertex AI from the site's own history. The prediction is shown on the map but never allowed to reroute anyone, and it is styled differently so nobody mistakes it for a confirmed hazard. Wind and air quality sit in the same view.

39 endpoints, 22 map layers

The application sits behind an identity-aware proxy with three-tier role-based access, so routing is same-origin and nobody signs in twice. The front end is around 17,000 lines of typed code across 25 data hooks and 22 independent map layers, each able to fail without taking the map down with it.

Project summary

Magnopus construction site platform quick facts

The essential product, role and delivery context behind the work.

What was built
A Gaussian-splat construction site viewer with dated captures, an automatic footage-to-splat pipeline and walkable routing, followed by a site operations and routing application with map overlays, a 3D site model, live GPS, closure-aware routing, hazards and role-based access.
Role
Full-stack web and spatial engineer on contract to Magnopus, June to September 2026, building both phases.
Stack
TypeScript, React, PlayCanvas, three.js, Draco, BigQuery GIS, Gemini on Vertex AI, XYZ tile pyramids, identity-aware proxy and role-based access control.
Outcome
Phase 2 was delivered as a phased proof of concept and is now in daily use by site staff and programme leadership.
Frequently asked questions

Short answers for people comparing approaches and similar technical work.

What was built for Magnopus?

Two phases of browser-based construction site software: a Gaussian-splat site viewer with a capture timeline and walkable routing, then a site operations and routing application with live GPS, closure-aware routing, hazard layers and a 3D model of the completed site.

Is the site operations application in use?

Yes. It was delivered as a phased proof of concept and is now in daily use by site staff and programme leadership.
What technology was used?

TypeScript and React in the browser, PlayCanvas for Gaussian splats, three.js for the 3D site model, server-side GIS routing in BigQuery and Gemini on Vertex AI for advisory hazard prediction.